---
title: "qqunif function with filtered p-values"
author: "Haky Im"
date: "2023-06-16"
---
## qqunif for filtered p-values
expected under the null is (1:nn) \* maxp / (nn+1)
```{r}
qqunif_maxp =
  function(p,BH=T,CI=T,mlog10_p_thres=30,maxp=1,...)
  {
    ## thresholded by default at 1e-30
    p=na.omit(p)
    nn = length(p)
    xx =  -log10( (1:nn)*maxp / (nn+1) )

    p_thres = 10^{-mlog10_p_thres}
    if( sum( p < p_thres) )
    {
      warning(paste("thresholding p to ",p_thres) )
      p = pmax(p, p_thres)
    }
    plot( xx,  -sort(log10(p)),
          xlab=expression(Expected~~-log[10](italic(p))),
          ylab=expression(Observed~~-log[10](italic(p))),
          cex.lab=1.4,mgp=c(2,1,0),
          ... )
    abline(0,1,col='gray')
    if(BH)
    {
      abline(-log10(0.05),1, col='red',lty=1)
      abline(-log10(0.10),1, col='orange',lty=2)
      abline(-log10(0.25),1, col='yellow',lty=3)
      legend('topleft', c("FDR = 0.05","FDR = 0.10","FDR = 0.25"),
             col=c('red','orange','yellow'),lty=1:3, cex=1)
      abline(h=-log10(0.05/nn)) ## bonferroni
    }
    if(CI)
    {
      ## create the confidence intervals
      c95 <- rep(0,nn)
      c05 <- rep(0,nn)
      ## the jth order statistic from a
      ## uniform(0,1) sample
      ## has a beta(j,n-j+1) distribution
      ## (Casella & Berger, 2002,
      ## 2nd edition, pg 230, Duxbury)
      ## this portion was posted by anonymous on
      ## http://gettinggeneticsdone.blogspot.com/2009/11/qq-plots-of-p-values-in-r-using-ggplot2.html

      for(i in 1:nn)
      {
        c95[i] <- qbeta(0.95,i,nn-i+1)*maxp
        c05[i] <- qbeta(0.05,i,nn-i+1)*maxp
      }

      lines(xx,-log10(c95),col='gray')
      lines(xx,-log10(c05),col='gray')
    }
  }
```
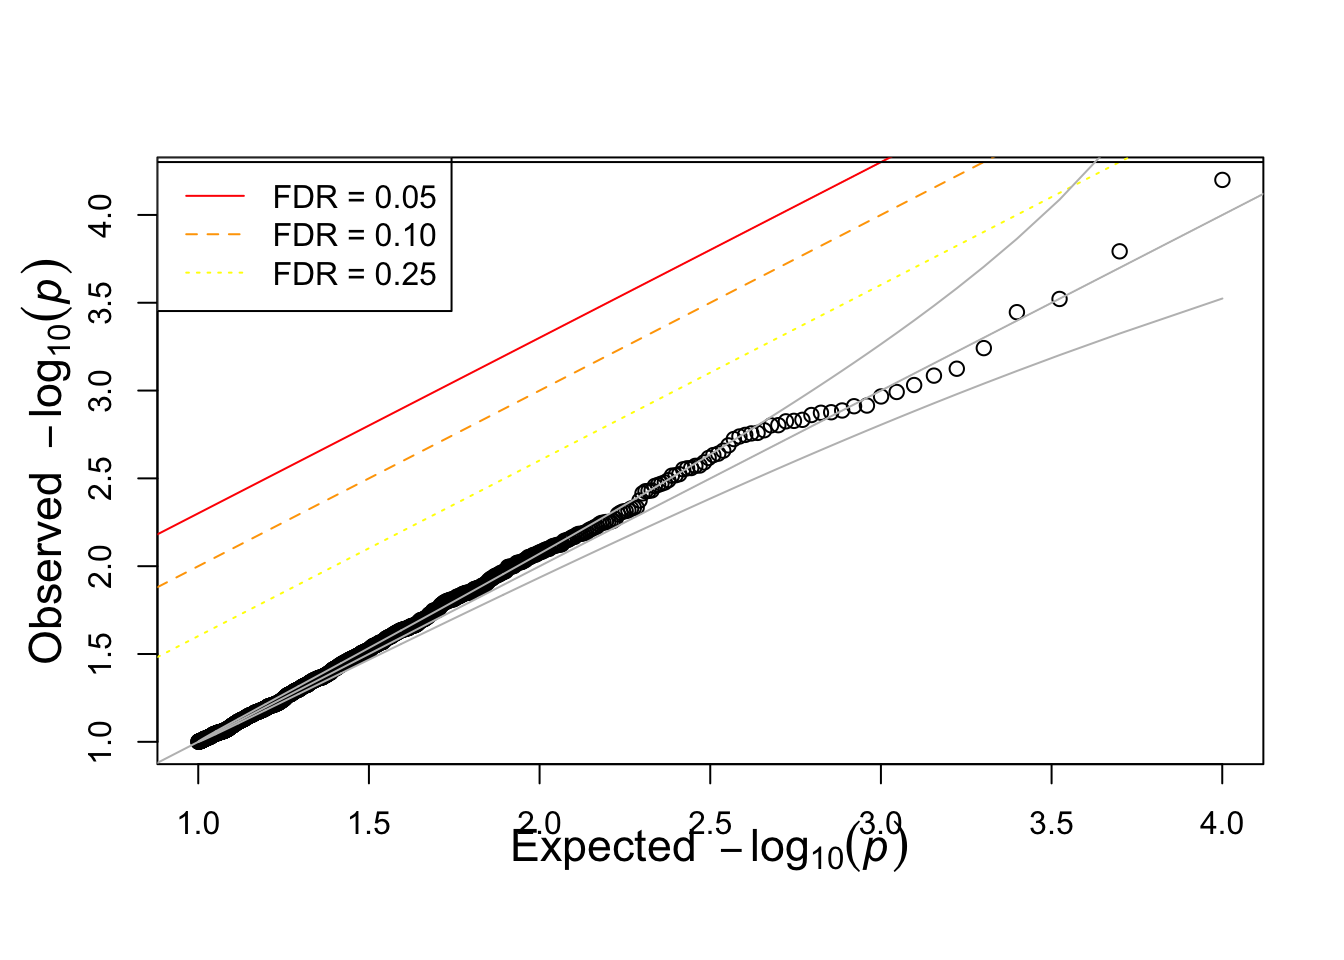
- [ ] find distribution of jth order statistic from a uniform(0,maxp) sample
```{r}
maxp=0.1
nullp = runif(1000,max=maxp)
qqunif_maxp(nullp,maxp=maxp)
```