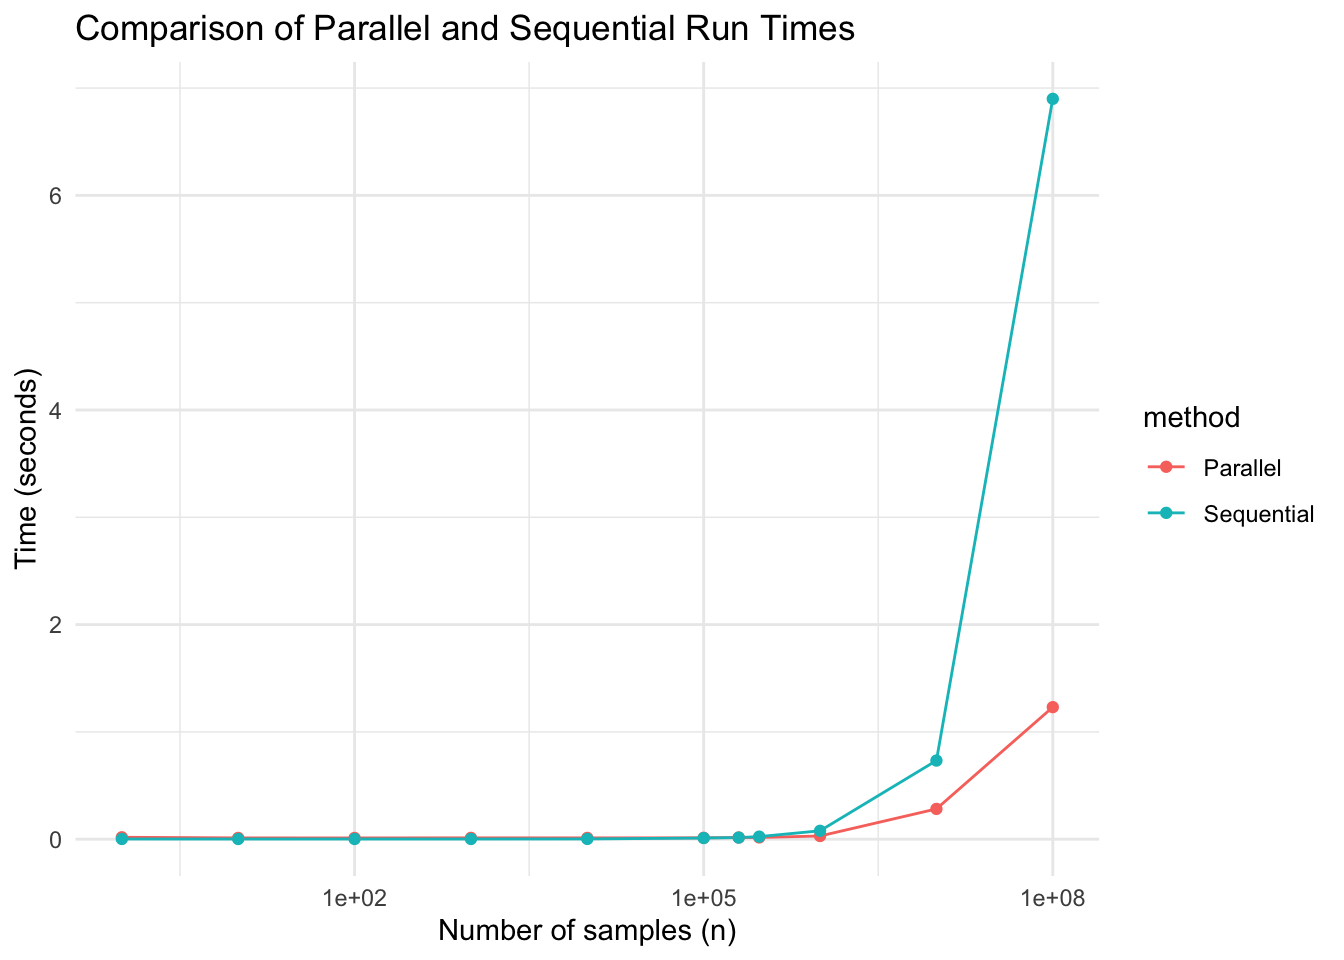
library(ggplot2)# Set up parallel backendn.cores <-detectCores() -1registerDoParallel(cores = n.cores)nsim <-9n_values <-c(1, 10, 100, 1000, 10000, 100000,2e5,3e5, 1000000, 10000000, 1e8)results <-data.frame(n =integer(), method =character(), time =numeric(), stringsAsFactors =FALSE)for (n in n_values) {# Parallel run tic_parallel <-Sys.time()foreach(i =1:nsim, .combine ='c') %dopar% {mean(runif(n) ^2) } toc_parallel <-Sys.time() parallel_time <-as.numeric(toc_parallel - tic_parallel, units ="secs")# Sequential run tic_sequential <-Sys.time()foreach(i =1:nsim, .combine ='c') %do% {mean(runif(n) ^2) } toc_sequential <-Sys.time() sequential_time <-as.numeric(toc_sequential - tic_sequential, units ="secs")# Store results results <-rbind(results, data.frame(n = n, method ="Parallel", time = parallel_time)) results <-rbind(results, data.frame(n = n, method ="Sequential", time = sequential_time))}# Plot resultsggplot(results, aes(x = n, y = time, color = method)) +geom_line() +scale_x_log10() +# scale_y_log10() +geom_point() +labs(x ="Number of samples (n)", y ="Time (seconds)", title ="Comparison of Parallel and Sequential Run Times") +theme_minimal()
Show the code
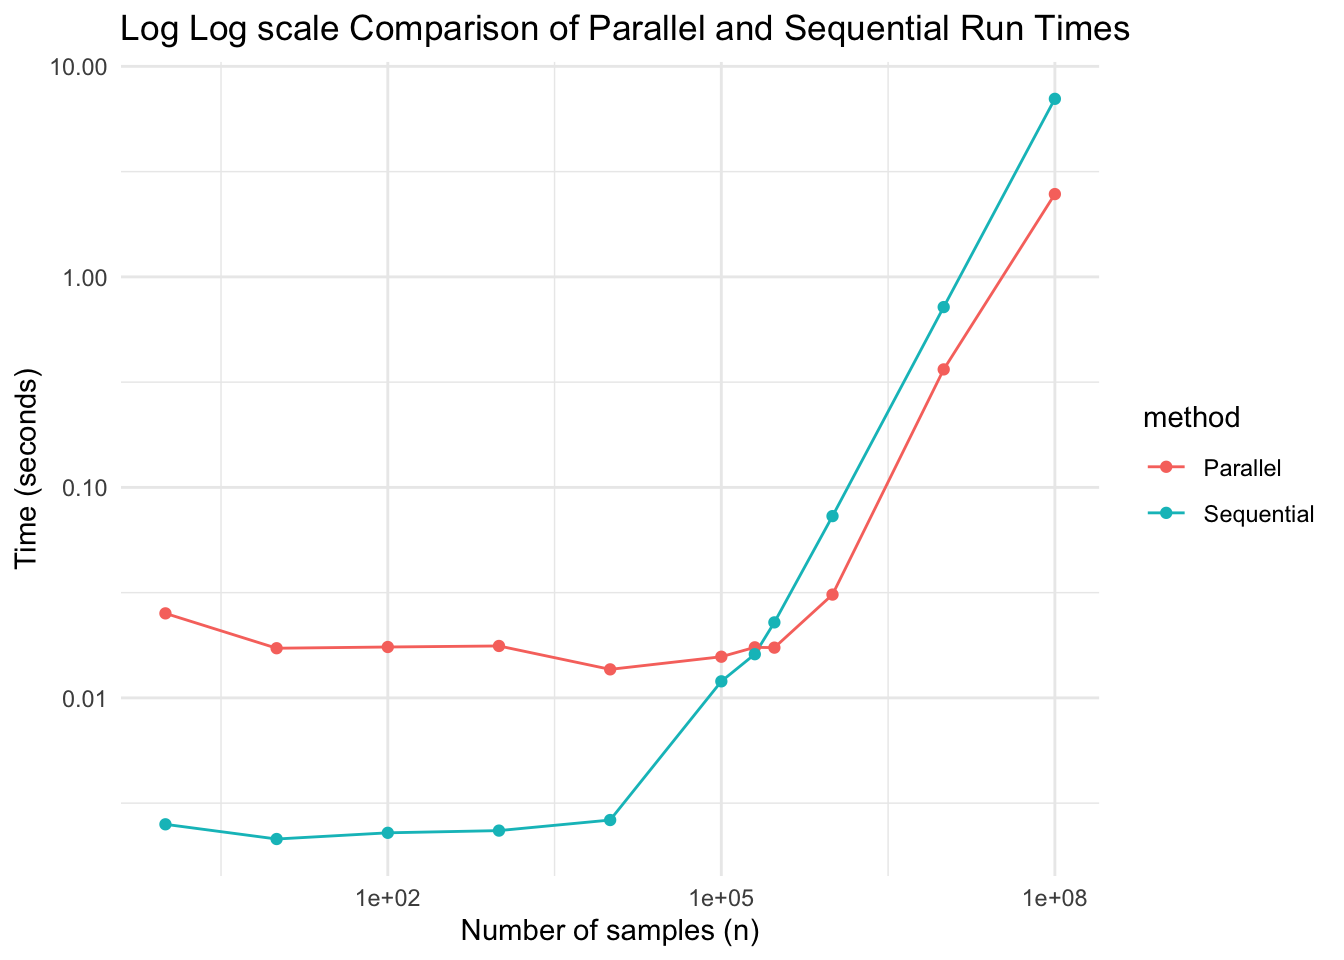
# Plot resultsggplot(results, aes(x = n, y = time, color = method)) +geom_line() +scale_x_log10() +scale_y_log10() +geom_point() +labs(x ="Number of samples (n)", y ="Time (seconds)", title ="Log Log scale Comparison of Parallel and Sequential Run Times") +theme_minimal()
In this exammple, n~2e5 is the break even point, beyond which, the overhead of parallel computation is offset by the parallel computation
---title: how to run for loops in parallel in Rauthor: Haky Imdate: 2024-02-16editor_options: chunk_output_type: console---```{r}library(foreach)library(doParallel)library(ggplot2)# Set up parallel backendn.cores <-detectCores() -1registerDoParallel(cores = n.cores)nsim <-9n_values <-c(1, 10, 100, 1000, 10000, 100000,2e5,3e5, 1000000, 10000000, 1e8)results <-data.frame(n =integer(), method =character(), time =numeric(), stringsAsFactors =FALSE)for (n in n_values) {# Parallel run tic_parallel <-Sys.time()foreach(i =1:nsim, .combine ='c') %dopar% {mean(runif(n) ^2) } toc_parallel <-Sys.time() parallel_time <-as.numeric(toc_parallel - tic_parallel, units ="secs")# Sequential run tic_sequential <-Sys.time()foreach(i =1:nsim, .combine ='c') %do% {mean(runif(n) ^2) } toc_sequential <-Sys.time() sequential_time <-as.numeric(toc_sequential - tic_sequential, units ="secs")# Store results results <-rbind(results, data.frame(n = n, method ="Parallel", time = parallel_time)) results <-rbind(results, data.frame(n = n, method ="Sequential", time = sequential_time))}# Plot resultsggplot(results, aes(x = n, y = time, color = method)) +geom_line() +scale_x_log10() +# scale_y_log10() +geom_point() +labs(x ="Number of samples (n)", y ="Time (seconds)", title ="Comparison of Parallel and Sequential Run Times") +theme_minimal()# Plot resultsggplot(results, aes(x = n, y = time, color = method)) +geom_line() +scale_x_log10() +scale_y_log10() +geom_point() +labs(x ="Number of samples (n)", y ="Time (seconds)", title ="Log Log scale Comparison of Parallel and Sequential Run Times") +theme_minimal()```> In this exammple, n~2e5 is the break even point, beyond which, the overhead of parallel computation is offset by the parallel computation